 Sunil Rao
When international professionals relocate to Stockholm, Gothenburg, or Malmö, they almost universally assume that Sweden spends a larger share of its national economy on cash social insurance benefits than almost anywhere else in Europe. On 4 November 2026, the Swedish Social Insurance Agency (Försäkringskassan) published a landmark analytical report - Socialförsäkringsutgifternas utveckling över tid (Korta analyser 2026:6, FK-nr: 116-55) - proving that the exact opposite is now true.
Authored by Försäkringskassan analysts Johan Olofsson and Alma Wennemo Lanninger using harmonized Eurostat ESSPROS data (spr_exp_ftm), the report reveals that over the past three decades, Sweden's social insurance expenditure as a share of GDP (utgiftskvot) has fallen from 19.1 percent in 1995 to 14.2 percent in 2024.
That 5.1 percentage-point drop (between 1995 and 2023) is the single largest reduction among all EU-15 and Nordic nations, transforming Sweden from one of Europe's highest-spending cash welfare states in the mid-1990s into the second-lowest in the entire EU-15 today - ahead only of Ireland. Even more importantly for expats and employees working in Sweden, Försäkringskassan's analysis explains why this shift happened: as statutory benefit caps and eligibility rules tightened, Sweden quietly shifted a massive portion of its middle- and high-earner income safety net out of the state budget and into workplace collective agreements (kollektivavtal) and union income insurance (inkomstförsäkring). Here is the complete breakdown of Korta analyser 2026:6 and what it means for your financial security in Sweden.
Key Takeaways: Försäkringskassan Report 2026:6 (Published 4 November 2026)
- Second-Lowest Ratio in the EU-15: Sweden's cash social insurance spending dropped from 19.1% of GDP in 1995 to 14.2% of GDP in 2024 (-4.9 percentage points through 2024; -5.1 percentage points in the 1995-2023 EU-15 comparison), leaving only Ireland with a lower ratio in Western Europe.
- 87% Real GDP Growth vs. 53% Real Benefit Growth: In 2024 inflation-adjusted prices, Sweden's social insurance spending rose from 592 billion SEK in 1995 to 904 billion SEK in 2024 (+53%), but Sweden's real GDP grew by 87% over the same period.
- Non-Pension Benefits Shrank by 43 Billion SEK in Real Terms: Every krona of real spending growth since 1995 went to old-age pensions (635.7 billion SEK in 2024). Across all working-age and family benefits combined, real spending in 2024 prices actually fell by 43 billion SEK.
- Unemployment & Disability Drove Over 80% of the Drop: Unemployment spending plunged from 2.9% to 0.6% of GDP (-2.3 percentage points) and disability benefits fell from 2.5% to 0.8% of GDP (-1.7 percentage points) following the strict 2008 sickness insurance reforms.
- The Hidden Shift to Collective Agreements (Kollektivavtal): Försäkringskassan notes that because state ceilings do not cover full salaries, occupational and union-negotiated top-ups (excluded from public GDP ratios) now carry a much larger share of Sweden's real income protection.
1. From 19.1% to 14.2% of GDP: How Sweden's Social Insurance Ratio Fell Faster Than Any Other EU-15 Country
In Korta analyser 2026:6, Försäkringskassan tracks Sweden's social insurance expenditure ratio (utgiftskvot = total cash social insurance payouts divided by Gross Domestic Product) over the 30-year period from 1995 to 2024 using Eurostat's European System of Integrated Social Protection Statistics (ESSPROS, table spr_exp_ftm).
Note an important statistical distinction highlighted by Försäkringskassan on Page 1 and Page 7 of the report: Sweden's broader welfare state comprises both publicly funded in-kind services (such as universal healthcare, subsidized preschool / förskola, elderly care, and free schooling/universities) and cash social insurance transfers (pensions, sickness benefit / sjukpenning, parental benefit / föräldrapenning, child allowance / barnbidrag, disability compensation, and unemployment insurance). The 14.2 percent of GDP figure measures all cash social protection benefits paid to households across all statutory systems in Sweden.
| EU-15 Country (Top 5 Largest Reductions) | Change in Social Insurance GDP Ratio (1995 - 2023) | Key Structural & Macro Drivers |
|---|---|---|
| 1. Sweden (Sverige) | -5.1 percentage points (19.1% in 1995 to 14.2% in 2024) | 87% real GDP growth (1995-2024), strict 2008 disability/sickness reforms, and shift toward collective agreement top-ups |
| 2. Ireland (Irland) | -4.3 percentage points (Lowest ratio in EU-15) | Rapid multinational GDP expansion and younger demographic profile |
| 3. Denmark (Danmark) | -4.3 percentage points | Active labour-market ("flexicurity") reforms and strong GDP growth |
| 4. Netherlands (Nederländerna) | -3.3 percentage points | Privatization/employer-liability reforms in sickness & disability schemes |
| 5. Finland (Finland) | -3.0 percentage points (18.0% of GDP in 2023 - highest in Nordics) | Post-1990s depression recovery, though aging demographics keep total ratio at 18.0% |
As Analyst Johan Olofsson at Försäkringskassan explains in the agency's 4 November 2026 release, Sweden's dramatic shift in the European rankings reflects developments both inside Sweden and across the rest of the EU-15:
- From Above the EU-15 Median to 3.4 Percentage Points Below It: In 1995, Sweden had the 6th highest social insurance expenditure ratio in the EU-15, sitting 0.5 percentage points above the EU-15 median. By 2023, Sweden had dropped to 14th out of 15 (second lowest, ahead only of Ireland), sitting a full 3.4 percentage points below the EU-15 median.
- Why Southern Europe Moved in the Opposite Direction: While Sweden, Ireland, Denmark, the Netherlands, and Finland lowered their expenditure ratios through strong GDP growth and labour-market activation, several Southern European EU-15 nations saw their social insurance ratios surge between 1995 and 2023 due to slower GDP growth and rising pension outlays - led by Greece (+5.0 percentage points), Italy (~+4.0 percentage points), Portugal (~+4.0 percentage points), and Spain (+2.5 percentage points).
- How Sweden Diverged From the Rest of the Nordics After 2008: Among the five Nordic countries (Denmark, Finland, Iceland, Norway, and Sweden), differences have narrowed since 1995, when Sweden, Finland, and Denmark spent far more as a share of GDP than Norway and Iceland. However, after the 2008 global financial crisis, Sweden's trajectory broke sharply downward compared to its Nordic neighbors. By 2023, Finland had the highest Nordic ratio at 18.0 percent of GDP and oil-rich Norway had the lowest at 13.5 percent of GDP, with Sweden right behind Norway at the bottom of the Nordic table.
2. Where Does the Money Go? Complete Breakdown of Sweden's 904 Billion SEK Social Insurance Budget
A common misconception when reading that a country's spending ratio fell from 19.1 percent to 14.2 percent of GDP is to assume that total spending was slashed in absolute terms. Page 1 and Page 2 of Korta analyser 2026:6 show why the denominator (GDP) and the internal mix of benefits tell a much deeper story.
Measured in constant 2024 Consumer Price Index (CPI) kronor (2024 års penningvärde), Sweden's total social insurance expenditure was 592 billion SEK in 1995 and rose to 904 billion SEK in 2024 - a real-terms increase of 53 percent (+312 billion SEK) as Sweden's population expanded by nearly 20 percent from 8.8 million (1995) to 10.5 million (2023/2024). Over the exact same 1995-2024 window, however, Sweden's real GDP expanded by 87 percent (and by 84 percent between 1995 and 2023).
Even more revealing is how that 904.3 billion SEK was distributed across Sweden's six Eurostat social protection categories in 2024:
| Social Insurance Category (Eurostat ESSPROS) | Swedish Benefits Included | 2024 Expenditure (Million SEK) | Share of Total 2024 Payouts | Change in GDP Share (1995 - 2024) |
|---|---|---|---|---|
| 1. Old-Age Pensions (Ålderspension) | Inkomstpension, premiepension, and garantipension | 635,700 million SEK (635.7 bn SEK) | 70.3% | +0.9 percentage points (rose from ~9% to ~10% of GDP) |
| 2. Sickness (Sjukdom) | Primarily sjukpenning (sickness cash benefit) | 86,200 million SEK (86.2 bn SEK) | 9.5% | -0.1 percentage points (broadly unchanged as % of GDP) |
| 3. Family & Children (Familj och barn) | Föräldrapenning, barnbidrag, and underhållsstöd | 69,300 million SEK (69.3 bn SEK) | 7.7% | -0.8 percentage points |
| 4. Disability (Funktionsnedsättning) | Sjukersättning, aktivitetsersättning, and rehabiliteringspenning | 52,500 million SEK (52.5 bn SEK) | 5.8% | -1.7 percentage points (fell from 2.5% to 0.8% of GDP) |
| 5. Unemployment (Arbetslöshet) | A-kassa unemployment benefit and aktivitetsstöd | 38,700 million SEK (38.7 bn SEK) | 4.3% | -2.3 percentage points (fell from 2.9% to 0.6% of GDP) |
| 6. Other Payouts (Annan utbetalning) | Survivor pension (efterlevandepension) & social assistance (ekonomiskt bistånd) | 21,900 million SEK (21.9 bn SEK) | 2.4% | -1.0 percentage point |
| Total Swedish Cash Social Insurance (2024) | All 6 Eurostat Cash Benefit Functions | 904,300 million SEK (904.3 bn SEK) | 100.0% | -4.9 percentage points (19.1% to 14.2% of GDP) |
3. The 43 Billion SEK Working-Age Squeeze: Why Unemployment and Disability Benefits Account for Over 80% of the Drop
Look closely at Page 2 and Page 3 of Försäkringskassan's report and you will spot the single most important domestic fiscal fact in the entire study:
- Old-Age Pensions Drove 100% of Real Spending Growth: Because Sweden's population aged between 1995 and 2024, old-age pension payouts grew from roughly 9 percent to 10 percent of GDP (+0.9 percentage points), absorbing 635.7 billion SEK (more than 70 percent of every social insurance krona paid in Sweden).
- All Other Social Insurance Areas Shrank by 43 Billion SEK in Real Terms: Once you strip out old-age pensions, total spending on all working-age and family benefits (sickness, disability, unemployment, family/children, and social assistance) measured in 2024 CPI prices actually fell by 43 billion SEK between 1995 and 2024 - even though Sweden's population grew by 1.7 million people!
- Why Disability Spending Plunged From 2.5% to 0.8% of GDP: In 2008, Sweden enacted one of the strictest sickness and disability insurance reforms in the OECD, introducing the mandatory Rehabilitation Chain (rehabiliteringskedjan, testing work capacity against the entire regular labour market after Day 180) and tightening permanent disability eligibility (sjukersättning). As Försäkringskassan notes on Page 2, the number of people receiving sjukersättning has dropped by more than half since 2008, driving disability spending down by 1.7 percentage points of GDP.
- Why Unemployment Spending Plunged From 2.9% to 0.6% of GDP: Following the severe post-1990s crisis (when unemployment benefit spending stood at 2.9 percent of GDP in 1995), successive Swedish governments restrained the statutory a-kassa daily benefit ceiling (taket i a-kassan) while expanding earned-income tax credits (jobbskatteavdrag). Together, the reductions in unemployment (-2.3 percentage points) and disability (-1.7 percentage points) explain more than four-fifths (over 80 percent) of Sweden's entire net drop as a share of GDP.
4. What This Means for Expats in Sweden: Why Collective Agreements (Kollektivavtal) and Inkomstförsäkring Are Essential
On Pages 5 and 6 of Korta analyser 2026:6, Försäkringskassan analysts Johan Olofsson and Alma Wennemo Lanninger highlight a crucial takeaway that every foreign professional, tech worker, and family in Sweden must understand:
Why hasn't the drop in public social insurance spending left Swedish middle- and high-income earners unprotected? Because the labour market partners (unions and employers) stepped in to fill the gap through collective agreements (kollektivavtal)!
In Eurostat's international statistics, benefits negotiated between trade unions and employer confederations (kollektivavtalade försäkringar) and private union income insurances are not counted as public state social insurance expenditure. Yet in modern Sweden, if you earn a professional salary (for example, 45,000 to 75,000 SEK per month), the public Försäkringskassan and A-kassa caps cover only a fraction of your actual income:
- Sickness Benefit (Sjukpenning - 80% Cap at 10 Price Base Amounts): Public sjukpenning from Försäkringskassan is capped at 10 Price Base Amounts (prisbasbelopp) - equal to 588,000 SEK per year (49,000 SEK/month) in 2026, rising to 592,000 SEK/year (49,333 SEK/month) in 2027. If you earn above ~49,000 SEK/month and fall seriously ill, Försäkringskassan pays 0 SEK on the portion of your salary above the cap. It is your employer's collective agreement sickness insurance (such as
ITP/AGS) that tops up your sick pay from Day 15 to 90% of your lower salary slice and covers 80% of your salary above the Försäkringskassan ceiling! - Parental Leave Pay (Föräldrapenning vs. Föräldralön): Public föräldrapenning is also capped at 10 Price Base Amounts (~49,000 SEK/month in 2026). Under a Swedish collective agreement, your employer pays an additional 10% Parental Pay Top-Up (föräldralön / föräldrapenningtillägg) on your salary up to the cap AND pays 90% of your actual salary above the Försäkringskassan ceiling for up to 180 days. Without a collective agreement, a senior engineer or manager loses tens of thousands of kronor per month during parental leave.
- Unemployment Insurance (A-kassa + Union Inkomstförsäkring): Even after Sweden's October 2025 transition to an income-based a-kassa system, the public unemployment insurance ceiling is capped at a maximum qualifying salary of 34,000 SEK/month (paying 80% for Days 1-100, stepping down to 70% at Day 101 and 65% at Day 201). If you earn 55,000 SEK/month and lose your job, public a-kassa alone caps out at 27,200 SEK/month gross - unless you hold union income insurance (inkomstförsäkring) through a union like Unionen, Sveriges Ingenjörer, or Akavia, which insures 80% of your full salary up to 80,000 - 160,000 SEK/month!
Real-World Case Study: Two Expats Earning 60,000 SEK/Month in Stockholm - Public Safety Net Only vs. Full Collective Agreement + Union Stack
The Scenario: David and Elena are both software product managers in Stockholm earning 60,000 SEK/month gross. David works for a startup without a collective agreement and never joined an a-kassa or trade union. Elena works for an employer bound by a kollektivavtal (ITP 1) and is a member of her unemployment fund (a-kassa) and trade union (including inkomstförsäkring).
What Happens During Redundancy, Parental Leave, and Sick Leave (Why Försäkringskassan's 14.2% GDP Ratio Matters):
- If Made Redundant (Unemployment): Because David never joined an a-kassa (or only relies on the basic public floor), he faces the lowest tier of public support. Even if he had joined a-kassa alone, his benefit would be capped at 80% of 34,000 SEK = 27,200 SEK/month gross (less than half his 60,000 SEK salary). Elena, by contrast, combines her a-kassa with her union inkomstförsäkring, receiving 80% of her entire 60,000 SEK salary = 48,000 SEK/month for up to 150-200 days!
- During 6 Months of Parental Leave: David receives only Försäkringskassan's public föräldrapenning capped at 49,000 SEK/month (~77.6% of 49,000 SEK = ~38,000 SEK/month gross), losing 22,000 SEK/month. Elena receives public föräldrapenning PLUS her collective agreement föräldralön, bringing her total parental leave income to ~54,000 SEK/month (90% of her full 60,000 SEK salary) - an extra 96,000 SEK over six months!
The NordDaily Expat Protection Playbook: Försäkringskassan's Korta analyser 2026:6 is a wake-up call for every international resident in Sweden: high Swedish income taxes do not mean the state will automatically replace 80% of a high expat salary if you get sick, have a baby, or lose your job. With Sweden's public social insurance spending down to 14.2% of GDP (second lowest in the EU-15), your personal safety net depends on three steps you must take yourself: (1) Join an A-kassa on your very first week of employment in Sweden so you start building the 12-month income qualification window; (2) Join the relevant white-collar trade union (such as Unionen, Sveriges Ingenjörer, Akavia, or Saco) to activate inkomstförsäkring covering your salary above the 34,000 SEK public cap; and (3) Before signing a Swedish job offer, always check whether the company has a collective agreement (kollektivavtal) or equivalent occupational pension (4.5% up to ~50,375 SEK/mo and 30% above), parental pay top-up (föräldralön), and sickness top-up. Use our interactive Swedish A-kassa & Income Insurance Calculator to test your exact personal coverage today.
Official Sources & Statutory References
- Swedish Social Insurance Agency (Försäkringskassan - Press Release, 4 November 2026): Försäkringskassan via TT - Sveriges socialförsäkringsutgifter som andel av BNP är näst lägst i EU (4 november 2026)
- Försäkringskassan Official Report (Korta analyser 2026:6, FK-nr: 116-55, Full PDF): Socialförsäkringsutgifternas utveckling över tid - Korta analyser 2026:6 (Johan Olofsson & Alma Wennemo Lanninger, Försäkringskassan)
- Eurostat Social Protection Statistics (ESSPROS): Eurostat - Expenditure on social benefits by function, type of benefit and means-testing (spr_exp_ftm)
Related articles
Frequently asked questions
How much does Sweden spend on social insurance as a share of GDP according to Försäkringskassan's 2026:6 report?
According to Försäkringskassan's report Socialförsäkringsutgifternas utveckling över tid (Korta analyser 2026:6, FK-nr: 116-55), published on 4 November 2026, Sweden's social insurance expenditure as a share of GDP (utgiftskvot) fell from 19.1 percent in 1995 to 14.2 percent in 2024 (a decline of 4.9 percentage points, and 5.1 percentage points between 1995 and 2023). That gives Sweden the second-lowest social insurance expenditure ratio among all EU-15 countries, with only Ireland recording a lower share.
Did Sweden cut social insurance spending in actual kronor, or did GDP grow faster?
In real, inflation-adjusted terms (2024 CPI prices), total social insurance spending in Sweden actually increased by 53 percent between 1995 and 2024, rising from 592 billion SEK (in 2024 money) to 904 billion SEK. However, over the same period, Sweden's real GDP grew by 87 percent. Moreover, all of the real-terms spending increase went to old-age pensions (635.7 billion SEK in 2024); across all non-pension social insurance benefits combined, real expenditure in 2024 prices decreased by 43 billion SEK since 1995.
Which benefit categories saw the biggest reductions as a share of Sweden's GDP?
Over four-fifths (more than 80 percent) of the net decline in Sweden's social insurance expenditure ratio came from two areas: unemployment benefits (arbetslöshet), which fell from 2.9 percent of GDP in 1995 to 0.6 percent in 2024 (-2.3 percentage points), and disability benefits (funktionsnedsättning, such as sjukersättning and aktivitetsersättning), which dropped from 2.5 percent of GDP to 0.8 percent (-1.7 percentage points) after the strict 2008 sickness insurance reforms cut the number of sjukersättning recipients by more than half.
How does Sweden's social insurance spending compare with the other Nordic countries?
In 1995, Sweden, Finland, and Denmark had significantly higher social insurance expenditure ratios than Norway and Iceland, and Sweden sat above the Nordic average. Between 1995 and 2023, Sweden recorded the largest drop in the Nordic region (-5.1 percentage points), moving below the Nordic average, particularly after the 2008 financial crisis. In 2023 (the latest year with complete Eurostat data for all Nordic nations), Finland had the highest ratio at 18.0 percent of GDP and Norway had the lowest at 13.5 percent.
How is Sweden's 904 billion SEK in social insurance spending divided in 2024?
Out of 904.3 billion SEK in total cash social insurance expenditure in 2024, old-age pensions (ålderspension) accounted for 635.7 billion SEK (70.3 percent), sickness benefits (sjukdom / sjukpenning) for 86.2 billion SEK (9.5 percent), family and child benefits (familj och barn, including föräldrapenning and barnbidrag) for 69.3 billion SEK (7.7 percent), disability benefits (funktionsnedsättning) for 52.5 billion SEK (5.8 percent), unemployment benefits (arbetslöshet) for 38.7 billion SEK (4.3 percent), and other survivor/social assistance payouts for 21.9 billion SEK (2.4 percent).
Why does Försäkringskassan say collective agreements (kollektivavtal) have become so important in Sweden?
In Korta analyser 2026:6, Försäkringskassan highlights that a lower public expenditure ratio does not automatically mean total income protection has shrunk by the same amount for everyone, because collectively bargained and employer-paid insurances (kollektivavtalade ersättningar och avtalsförsäkringar) have grown substantially in importance. Because statutory social insurance caps (inkomsttak) do not cover high or upper-middle salaries, employees rely on employer top-ups (such as föräldralön, sjuklön via ITP/AGS, and union inkomstförsäkring) that are excluded from Eurostat's public expenditure ratio.
Estimate only. Talk to a qualified adviser before acting on anything here.
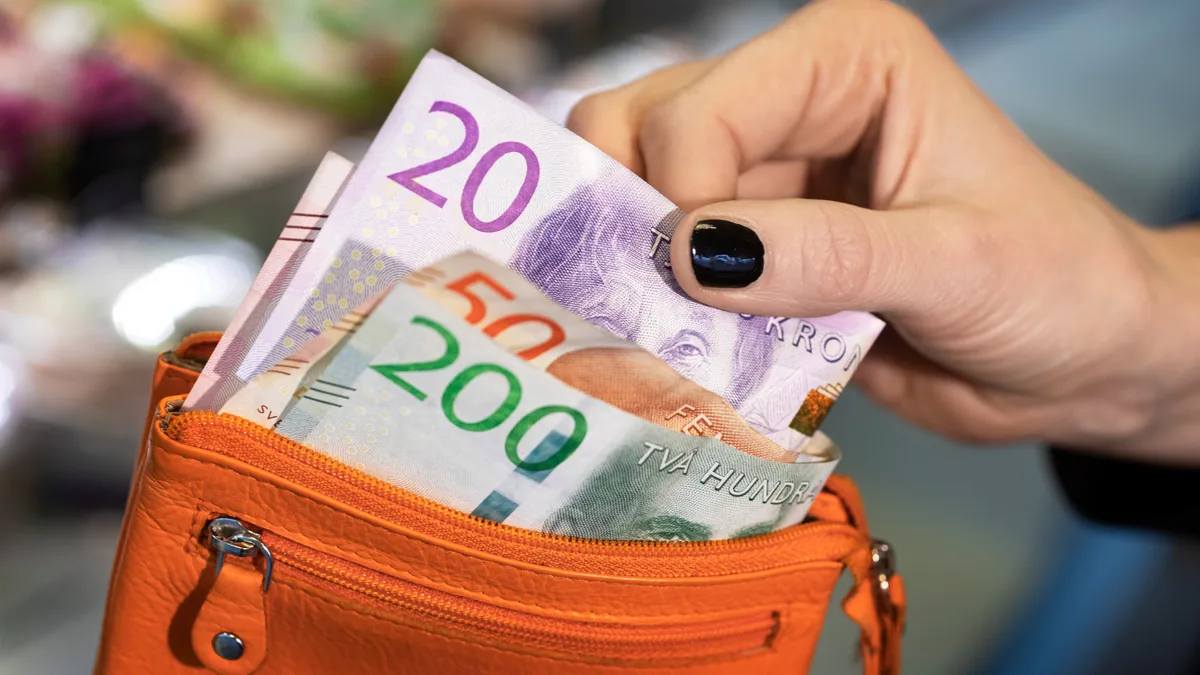
Photo: Simon Paulin / imagebank.sweden.se